
Help · user manual
Ticker&Tape user manual
Everything Ticker&Tape can do, tool by tool, with screenshots of the live site. Read it online or download the PDF.
Screenshots updated: 2026-10-02 · tickerandtape.com
01Getting started
Ticker&Tape is a free charting and research site for growth-stock traders. Create a free account with your email and you can save watchlists, screens, alerts, your portfolio and your settings, and use them on any device.
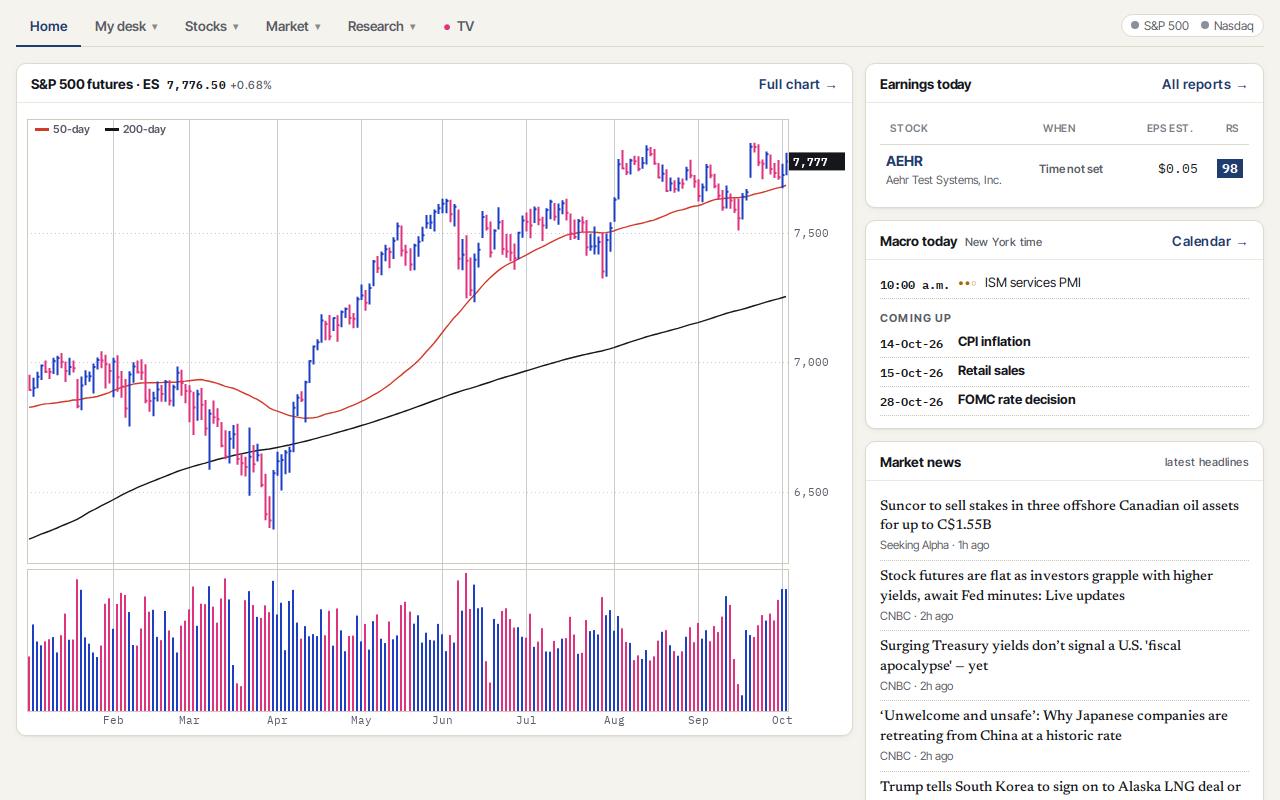
- Menu
- The menu at the top groups every tool in five places: Home (the market dashboard), My desk (your watchlist, portfolio and alerts), Stocks (screener, financial statements, superinvestors, trade ideas and earnings), Market (breadth, groups and rotation, heatmap, comparative charts and macro) and Research (reports, the trading school and this manual). TV opens live market channels. On a phone the menu opens from the button under the logo.
- Search box
- Type a ticker in the box at the top (or press /) and press Enter to open its chart. Company names work too.
- Home
- The dashboard shows S&P 500 futures, the market direction of the S&P 500 and the Nasdaq, the news, sectors, commodities and the leaders of the day.
- Market status
- The chip on the right of the menu tells you if the market is open and how the S&P 500 and the Nasdaq are doing today.
Tip Data is updated every trading day after the close, and prices refresh during the session.
02Reading a chart
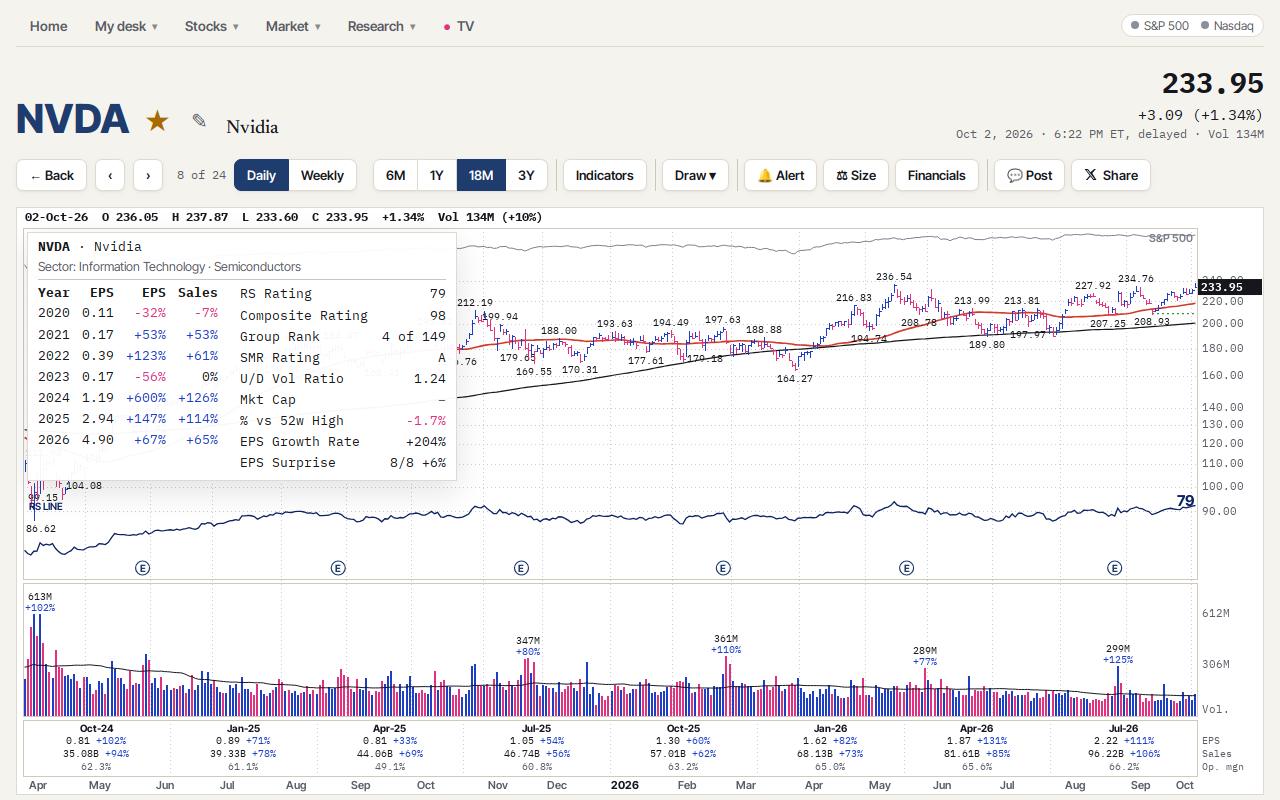
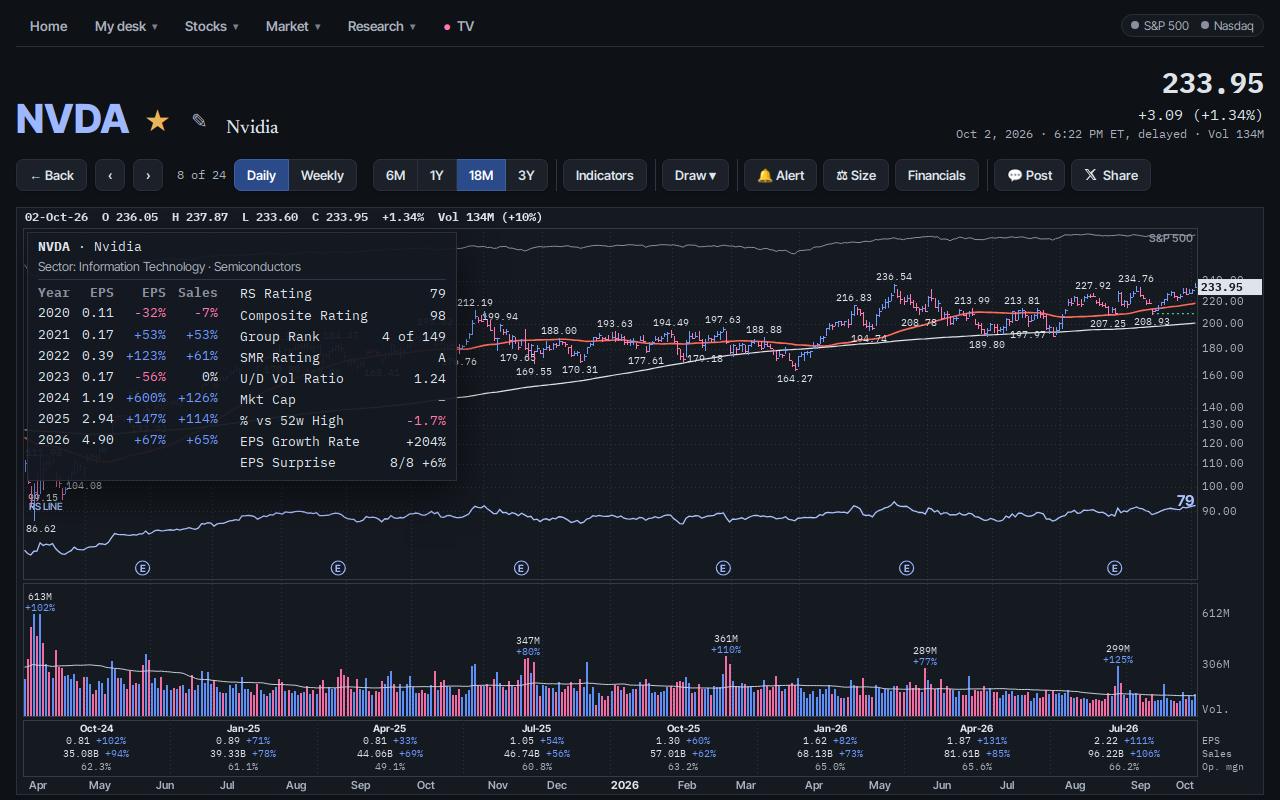
Every stock and ETF has a daily and weekly chart built for growth investing: price bars, moving averages, volume, the relative strength line and automatic base and pivot detection.
- Price bars
- By default bars show the high, low and close. You can switch to OHLC or candles in Settings. Blue bars closed up and pink bars closed down.
- Moving averages
- The 50-day (red) and 200-day (black) lines are on by default; the 10-day, 21-day EMA and 150-day can be added. On the weekly chart they become the 10- and 40-week lines.
- RS line
- The line under the price compares the stock with the S&P 500. A rising RS line means the stock is beating the market; a new RS high before the price is a strong sign.
- Bases and pivots
- Ticker&Tape finds cups, cups with handle, flat bases and other patterns, draws the base and marks the pivot (the buy point) and the buy zone up to 5% above it.
- Data box
- The box on the top left shows the RS Rating, Composite Rating, Group Rank, SMR Rating, Up/Down volume ratio, market cap and the yearly earnings and sales growth.
- Volume and earnings
- The volume panel marks the biggest volume days and its 50-day average. Under it, the quarterly EPS and sales with their growth. The (E) marks show earnings dates.
Tip Use the ← and → keys (or the ‹ › buttons) to move through the stocks of the list you came from.
03Chart tools
The buttons above the chart change the view and add your own work. Everything you draw is saved to your account.
- Daily / Weekly and range
- Switch between daily and weekly bars and choose 6 months, 1, 1.5 or 3 years.
- Indicators
- Turn moving averages and studies on and off, change their periods and colors, and save templates.
- Draw
- Trendlines, horizontal lines, rectangles and notes. Click a drawing to select it and delete it; Undo and Clear are in the same menu.
- Alert
- Set an alert on the price, a moving average, a trendline you drew or a breakout above the pivot.
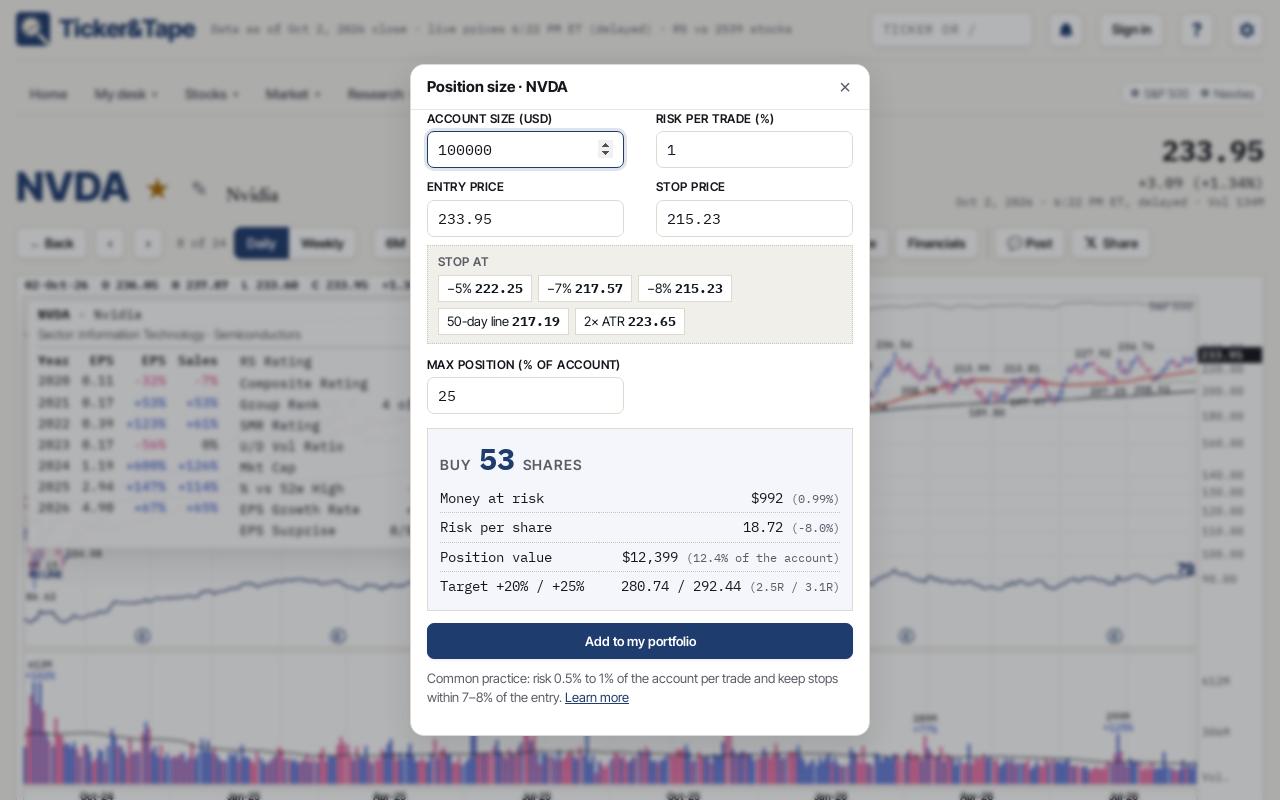
- Size
- The position size calculator: enter your account size and your risk per trade and it tells you how many shares to buy for your entry and stop.
- Financials and Share
- Financials opens the company's financial statements. Share copies a link or posts the chart to X.
Tip Every function is also in the command bar: type the ticker and the function, for example NVDA SIZE.
04Watchlist and screener
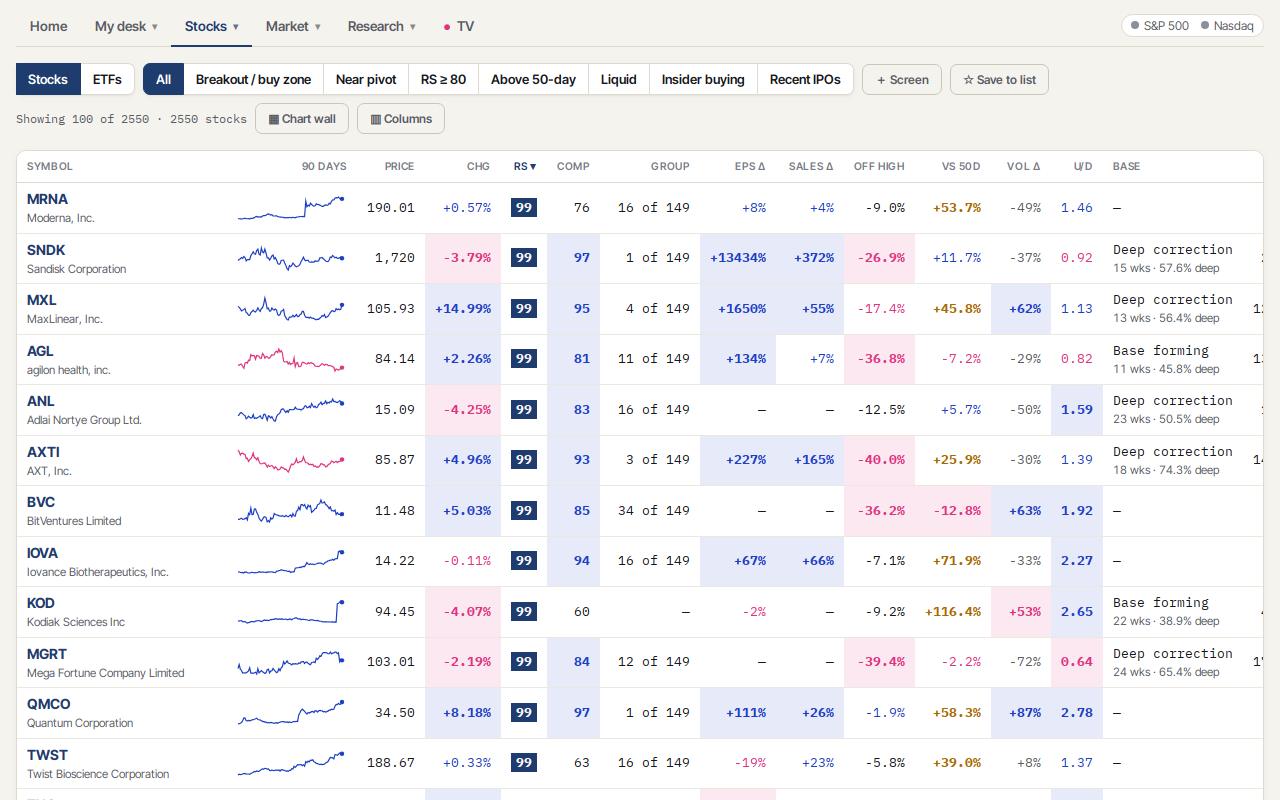
The screener ranks every U.S. stock (and, in its own tab, every ETF) by RS Rating, with the base, pivot and status of each one. Your watchlist uses the same table.
- Stocks, ETFs and watchlist
- The buttons on the left switch between all stocks, ETFs and your watchlist. Add a stock to the watchlist with the ★ on its chart.
- Quick screens
- Breakout / buy zone, Near pivot, RS ≥ 80, Above 50-day and Liquid filter the list in one click. + Screen builds your own screen with any column and saves it.
- Status
- Breakout, In buy zone, Near pivot, Extended, Below pivot and Failed breakout tell you where each stock stands against its pivot.
- Sort
- Click any column header to sort; click again to reverse it.
- Chart wall
- Shows the charts of the whole list as a grid, to scan many setups at once.
- Insider buying and recent IPOs
- Two more quick screens: stocks with open-market insider purchases in the last 90 days, and companies that started trading in the last 3 years. Short interest and days to cover are in the column library.
Tip Click a row to open the chart; the arrows on the chart then walk through the list in the same order.
05Columns and saved views
The Columns button opens the column library: choose which columns the table shows, in what order, and save the set as a view.
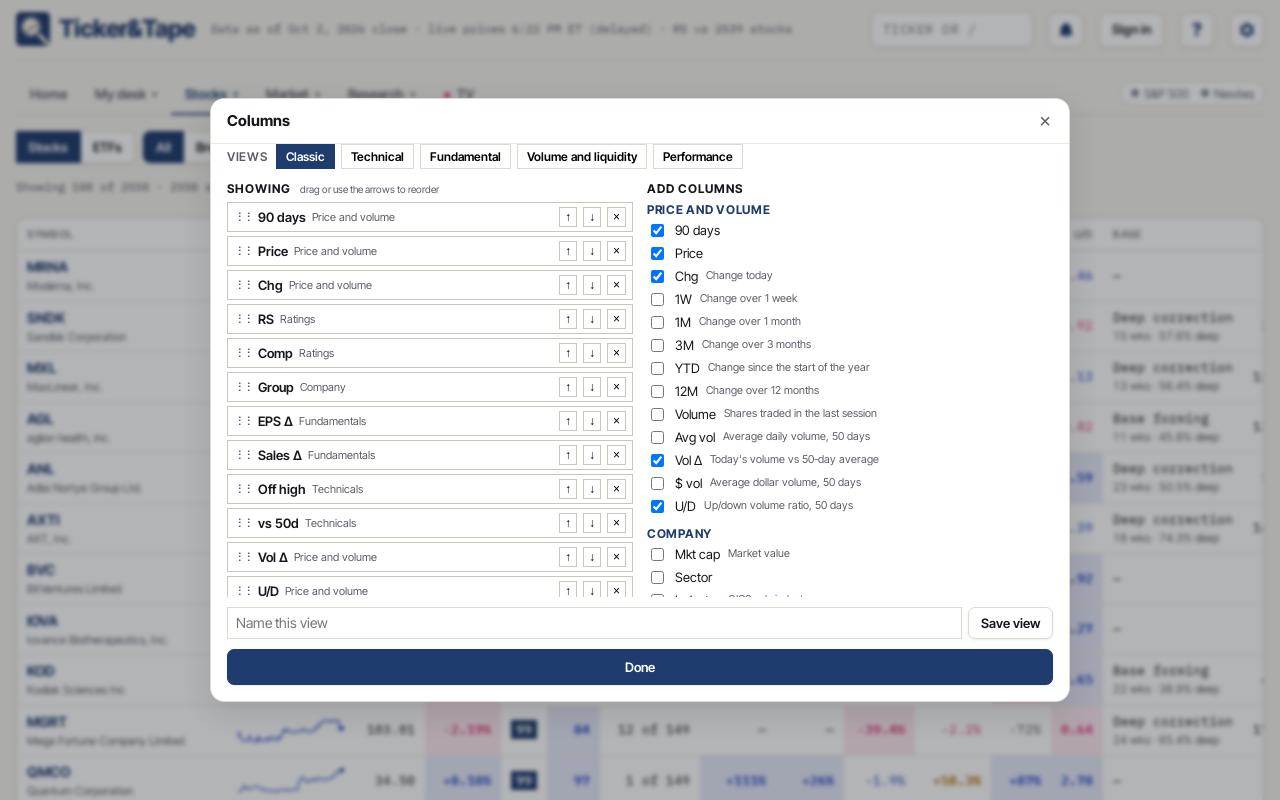
- Column library
- Ratings (RS, Composite, EPS and sales growth, SMR), price and volume (change, volume vs average, ADR, RSI, distance from highs and lows), bases and pivots, and fundamentals (P/E, P/S, margins, ROE, debt, free cash flow, net cash).
- Order
- Drag the columns or use the arrows to put them in the order you want.
- Views
- Save several column sets (for example "Technical" and "Fundamental") and switch between them in one click.
Tip Views and screens are saved to your account, so they follow you to your phone.
06Financial statements
Up to 15 years of income statement, balance sheet and cash flow for each company, from its SEC filings, annual or quarterly.
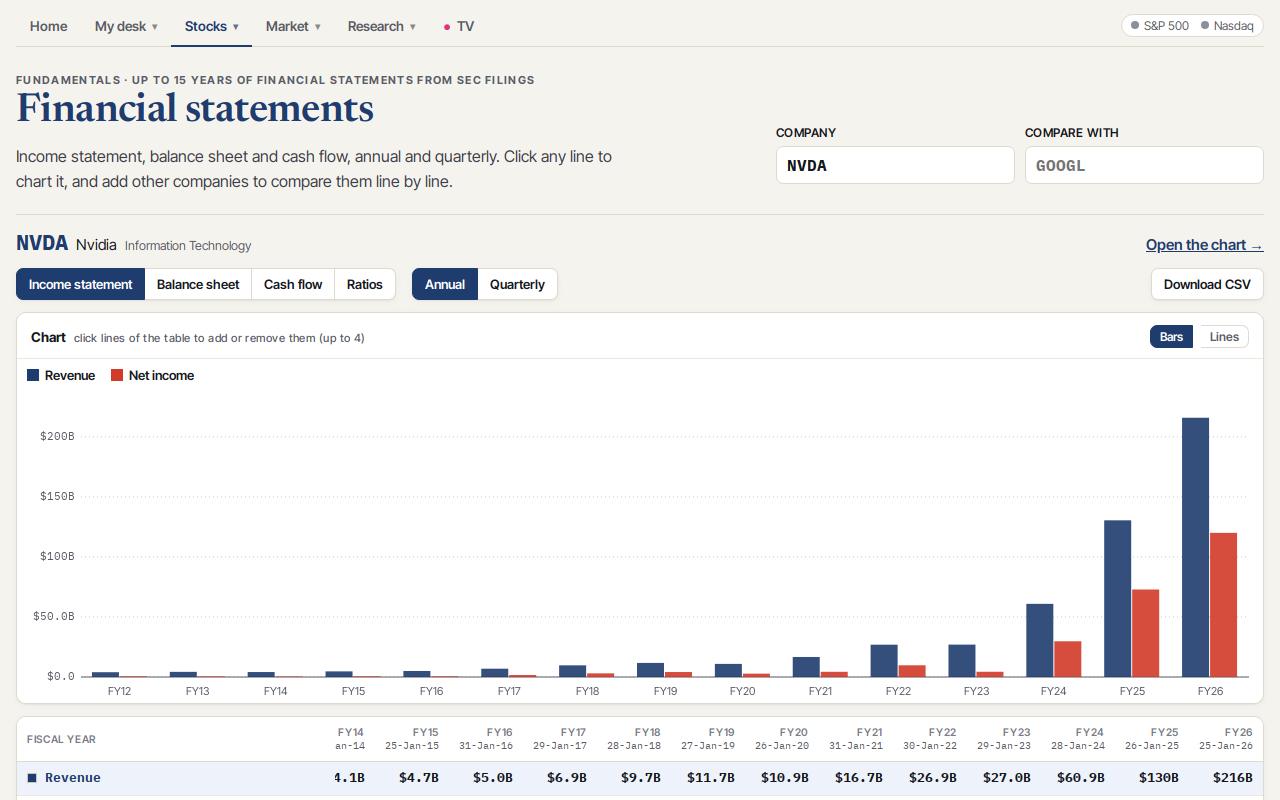
- Statements and ratios
- Income statement, Balance sheet, Cash flow and Ratios (margins, returns, growth, debt).
- Chart any line
- Click a line (revenue, net income, cash, debt…) to chart it over time.
- Compare
- Type other tickers in Compare with to chart the same line for several companies, for example the net cash of MSFT and GOOGL.
- Download
- Download CSV saves the table to open in Excel or Google Sheets.
Tip Shortcut: G then F, or type FA and the ticker in the command bar.
07Superinvestors
What the great investors own, from the 13F filings they send to the SEC every quarter: Buffett, Ackman, Druckenmiller, Li Lu, Tepper and more.
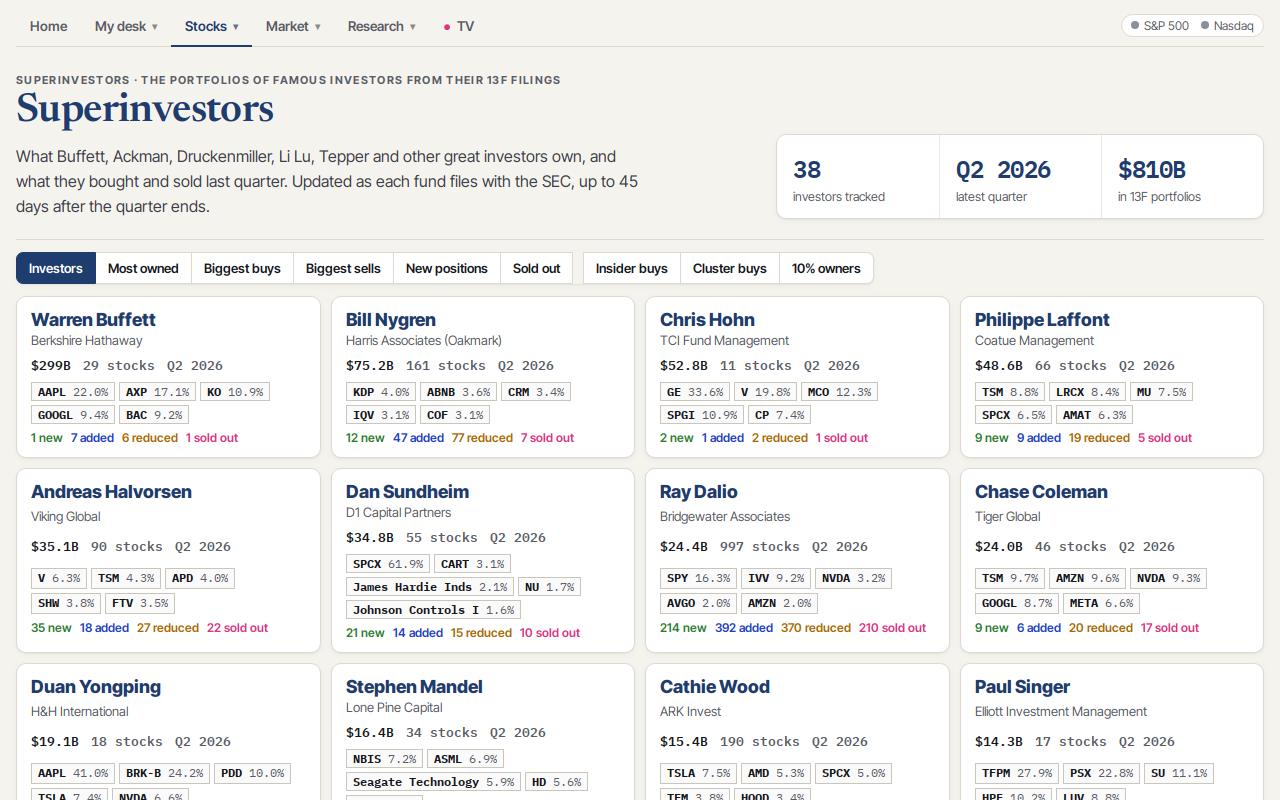
- Investors
- A card for each investor with the portfolio value, the top positions and what they bought and sold last quarter. Click it to see the whole portfolio.
- Most owned, biggest buys and sells
- Rankings across all the investors: the most widely held stocks, the biggest buys and sells, new positions and positions sold out.
- On the chart
- Each stock's chart page shows which superinvestors own it and how their position changed.
- Insider buys
- The Insider buys and Cluster buys tabs rank the stocks whose officers and directors bought shares in the open market in the last 90 days, from their SEC Form 4 filings. On the chart, a green (I) marks each day an insider bought.
Tip 13F filings arrive up to 45 days after the quarter ends, so they show what the investors owned, not what they own today.
08Trade ideas and earnings
Trade ideas lists, every day, the leaders that are near a buy point: strong RS, a sound base and a pivot close by, with the buy zone and a stop. Earnings shows this week's and next week's earnings reports.
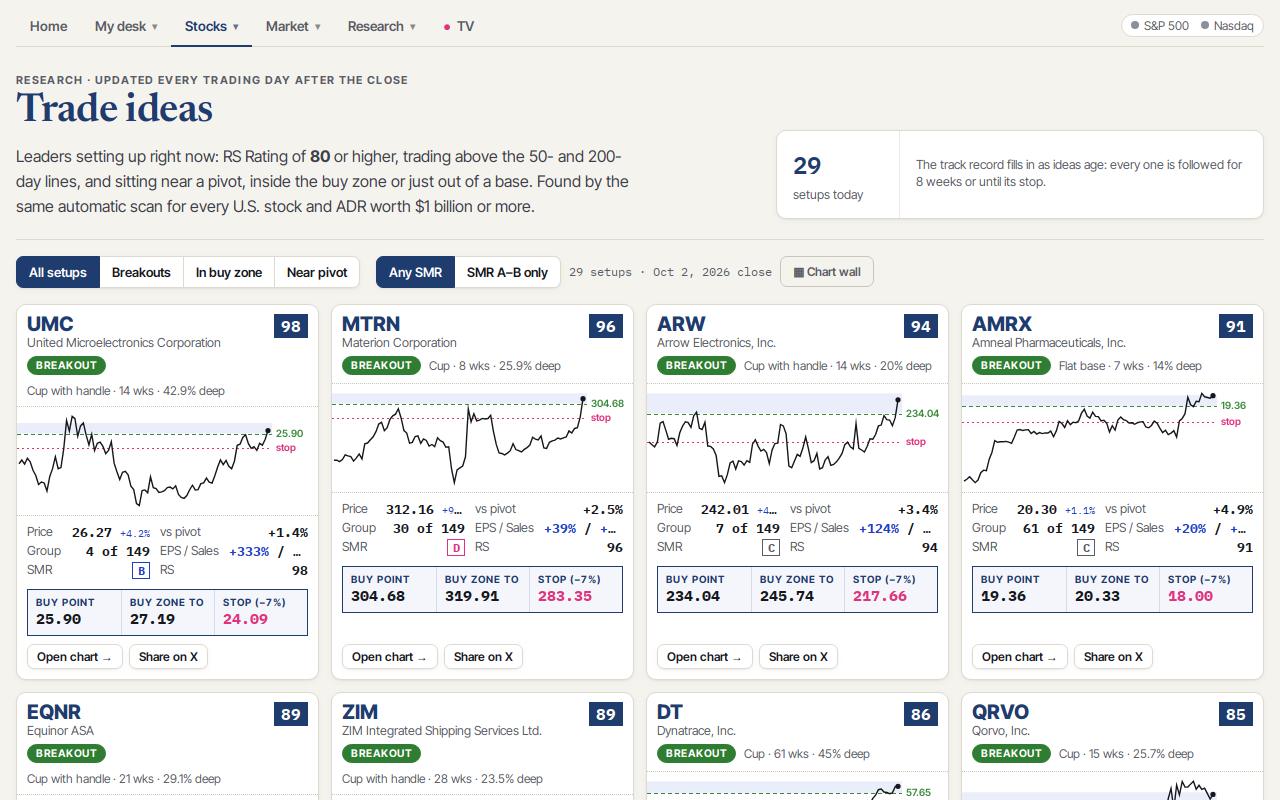
- Idea cards
- Each card shows the chart, the base, the pivot, the buy zone, the distance to the pivot and the stop.
- Earnings calendar
- Day by day, the companies that report, before or after the market, with their ratings. Avoid surprises in your positions.
Tip Ideas are found by the computer and are not recommendations: always check the chart and the market direction.
09Community
The Community (Research → Community) is a feed where traders share what they are watching: setups, charts, the market. Nothing is tracked: post freely.
- Post
- Choose your @name, then write in the box at the top of the feed. Tag stocks with $, like $NVDA: each tag opens the chart and the post shows a card with the stock. You need a confirmed email.
- Like, reply and follow
- Like posts, reply to them and follow the traders you like: their posts appear in Following.
- Search by ticker
- Type a ticker in the search box, or tap a stock in Trending, to see every post that mentions it.
- Pictures and charts
- Attach a picture with 🖼 Picture, or press 💬 Post on any chart to share it as you see it. Each post has a link (↗) with a preview for X and WhatsApp.
- Mentions and notifications
- Mention traders with @name. The bell tells you when someone replies, mentions you, follows you or likes your post. Pin one post to the top of your profile.
- Ticker&Tape's posts
- Every night the official account posts the market recap (with an image to share) and the scan's breakouts and upcoming setups from leading stocks.
Tip Posts are members' opinions, not investment advice. Report anything that breaks the rules.
10Portfolio
Log your trades and Ticker&Tape keeps your positions, your P&L by day, week, month and year, your stats as a trader and your journal. It is private: only you can see it.
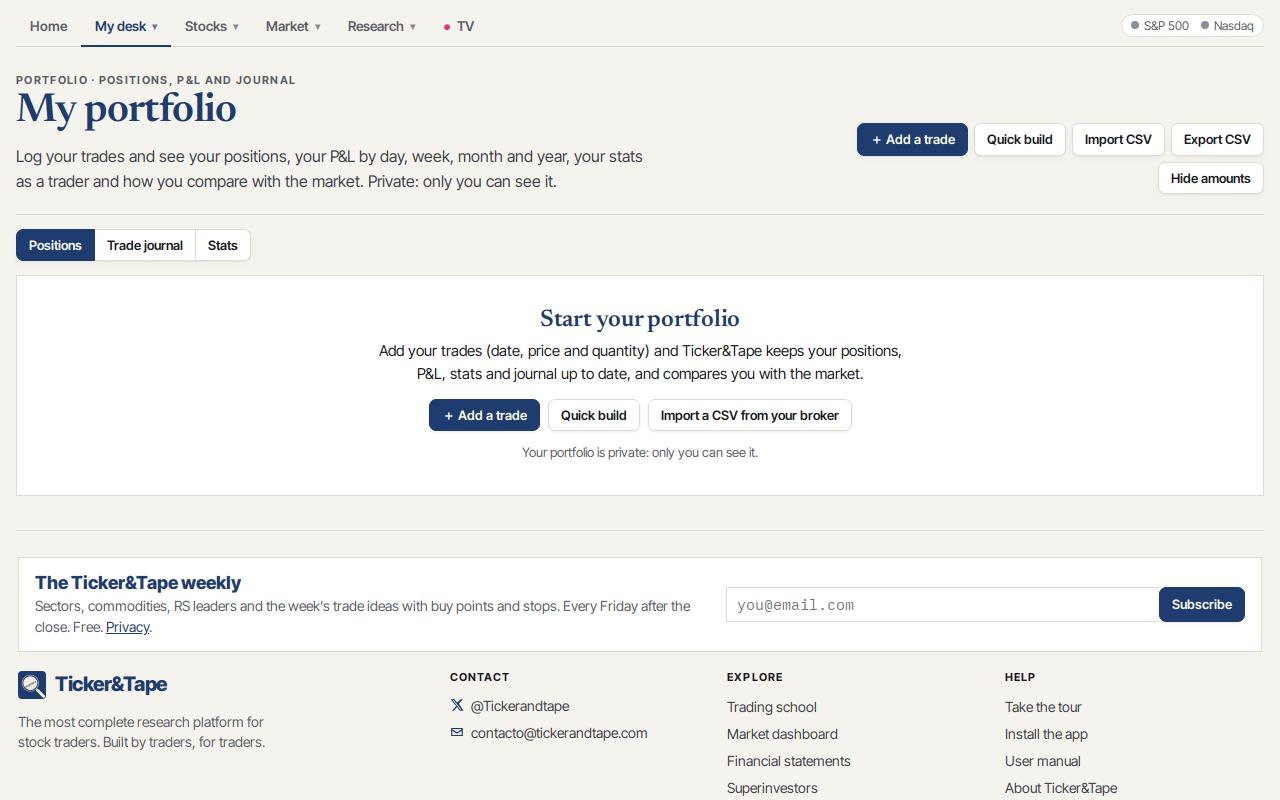
- Add a trade
- Date, ticker, buy or sell, price and quantity. Quick build adds several positions at once.
- Import and export
- Import a CSV from your broker and export your trades whenever you want.
- Positions, journal and stats
- Positions with their gain and weight; the trade journal with your notes; and stats such as win rate, average gain and loss and how you compare with the S&P 500.
- Discipline
- In each trade, record whether you followed your plan and how you felt. The stats show your results with and without discipline, and by emotion.
- Hide amounts
- Hides the dollar amounts to share a screen without showing your money.
11Alerts
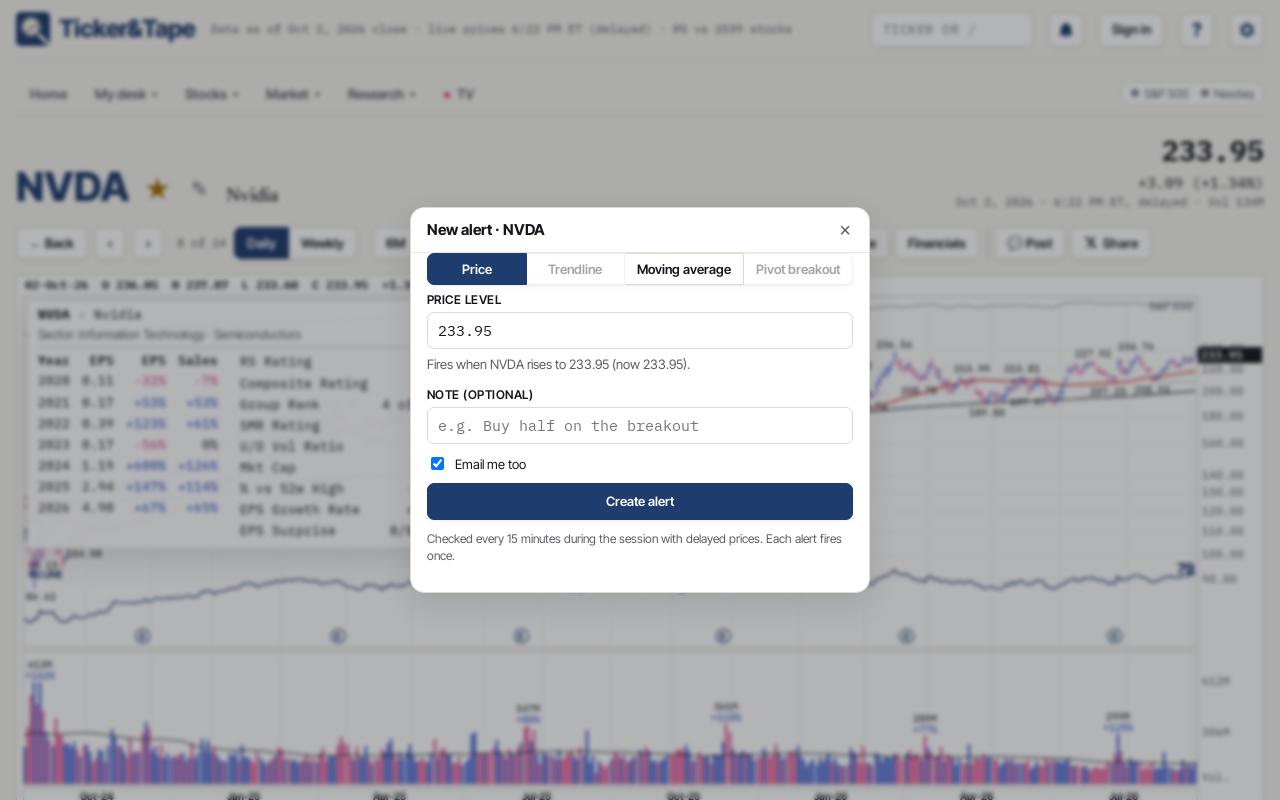
Alerts let you stop watching the screen: Ticker&Tape tells you when a stock does what you are waiting for.
- Types
- Price above or below a level, crossing a moving average, touching a trendline you drew, or breaking out above the pivot.
- How you get them
- By email and, if you installed the app and allowed notifications, as a push notification on your phone or computer.
- List alerts
- Watch a whole list at once: your watchlist, a saved screen or all stocks with RS 80+. Get notified when any of them breaks out above its pivot with volume, gets within 3% of its pivot or falls below its 50-day line.
- My alerts
- In My desk → My alerts you see, edit and delete all your alerts, and create list alerts.
Tip Set the alert from the chart with the Alert button, or type NVDA ALRT in the command bar.
12Market breadth
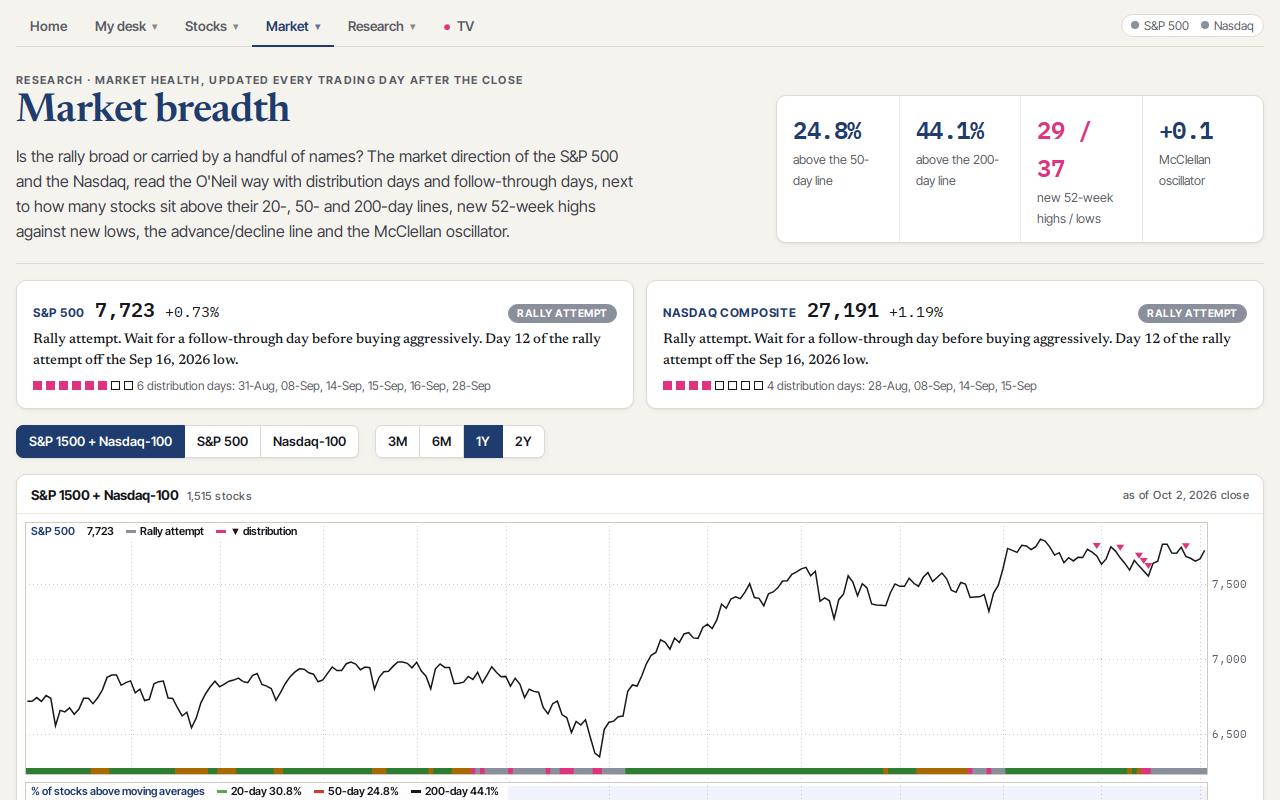
Is the rally broad or carried by a handful of names? Breadth shows the market direction and its health, every day after the close.
- Market direction
- Confirmed uptrend, Uptrend under pressure or Correction for the S&P 500 and the Nasdaq, read with distribution days and follow-through days.
- Distribution days
- Down days on higher volume. Many in a few weeks warn that big investors are selling.
- Breadth panels
- Stocks above their 20-, 50- and 200-day lines, new 52-week highs against lows, the advance/decline line and the McClellan oscillator.
Tip Most stocks follow the market: buy breakouts in a confirmed uptrend and be careful in a correction.
13Groups, rotation, heatmap and comparisons
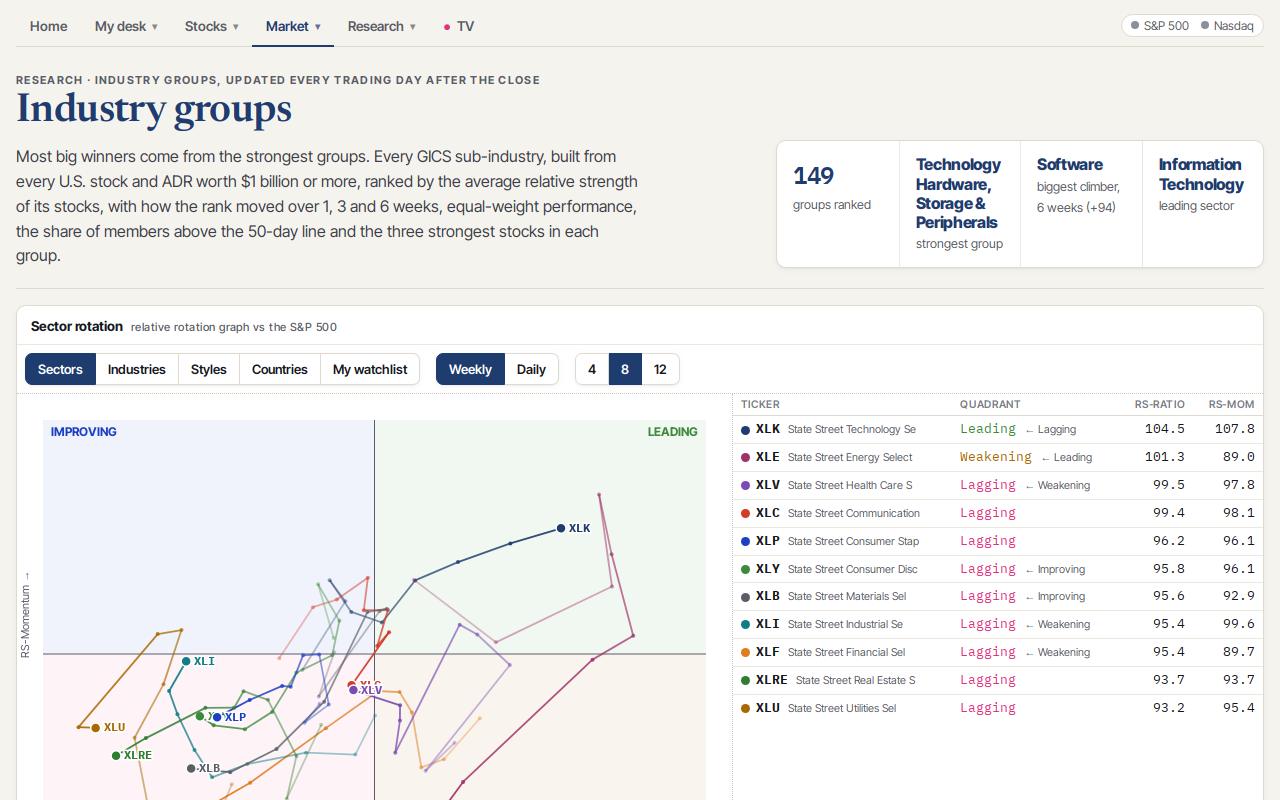
Most big winners come from the strongest groups. These tools show where the money is going.
- Industry groups
- Every industry ranked by the relative strength of its stocks, with how the rank moved over 1, 3 and 6 weeks and its best three stocks.
- Sector rotation
- The rotation graph places sectors, industries, styles, countries or your watchlist in four quadrants: Leading, Weakening, Lagging and Improving, with a tail of the last weeks.
- Heatmap
- The S&P 500, the Nasdaq-100 or your watchlist as boxes sized by market cap and colored by the change over a day, a week, a month or by RS Rating.
- Comparative charts
- Stack several tickers on one chart or chart a ratio such as RSP:SPY (equal weight against the index).
14Macro calendar and the Fed
The economic releases and Fed events that move the market, with what the futures market expects from the Fed. All times are New York time.
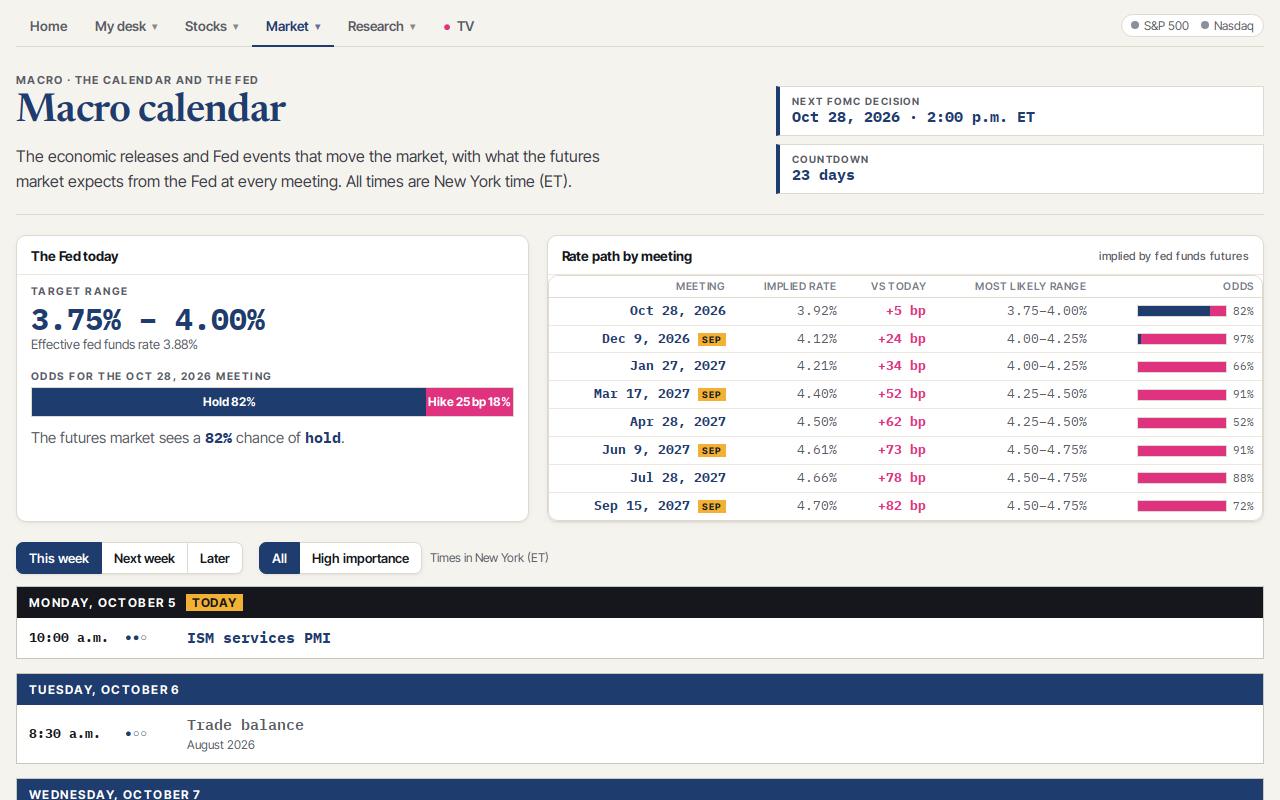
- The Fed today
- The target range, the effective rate and the odds for the next meeting.
- Rate path
- The rate implied by fed funds futures for each meeting this year.
- Calendar
- This week, next week and later; filter by high importance. Each release shows the latest value and the prior one.
15Research reports and the trading school
Research reports has The Daily Tape after every session and The Weekly Tape every Friday, in PDF: the market, sectors, leaders and trade ideas in five pages or fewer. The Trading school is a free course from zero, in three languages.
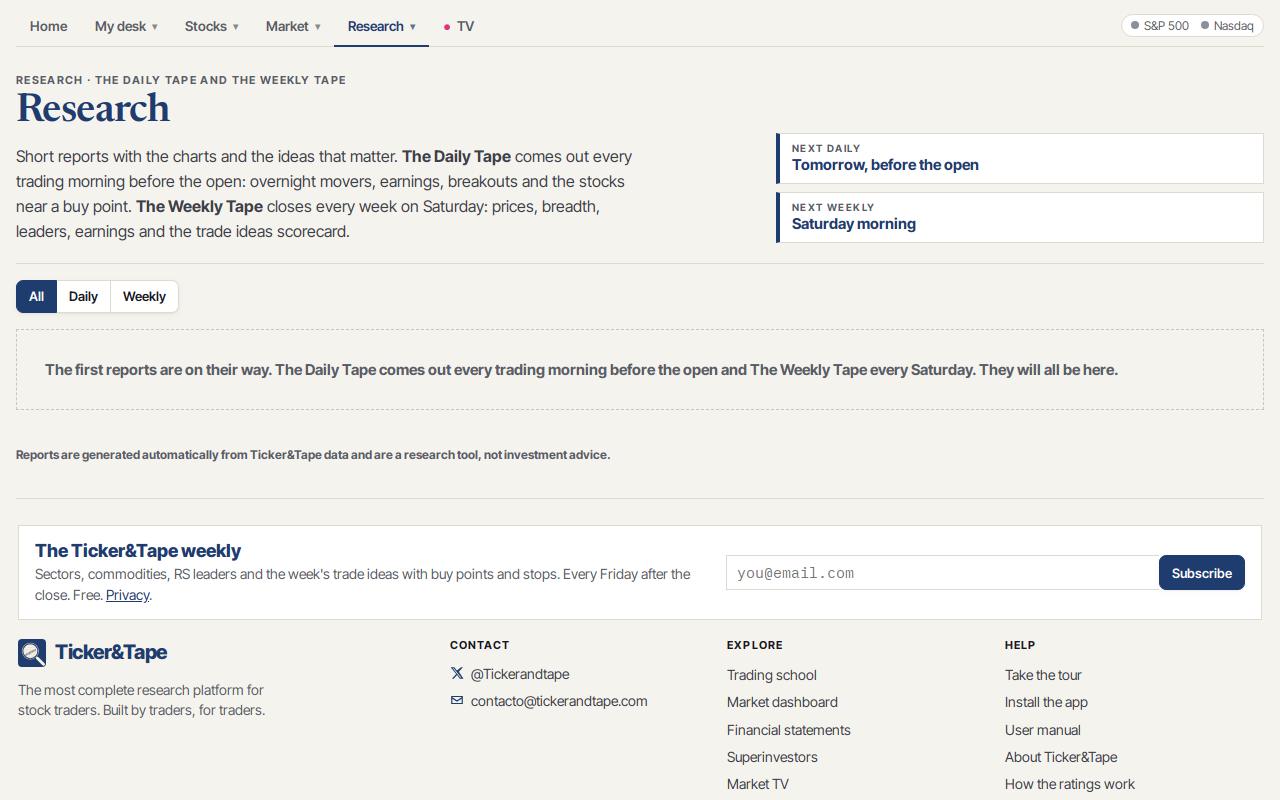
- Reports
- Read them online or download the PDF. You can also get The Weekly Tape by email with the newsletter at the bottom of every page.
- Trading school
- 17 modules and 76 lessons: from what the stock market is and how to place your first trade to bases, buy points, risk and portfolio management, with diagrams, live examples, a quiz in every lesson, your progress saved and a certificate at the end.
- Breakout statistics
- How every breakout found by the site worked out over the last two years with a +20% / −8% plan, by base type, market direction, breakout volume, RS line and base depth.
16Market TV
Live market channels in one place. Choose a channel and keep watching in the mini player while you move around the site.
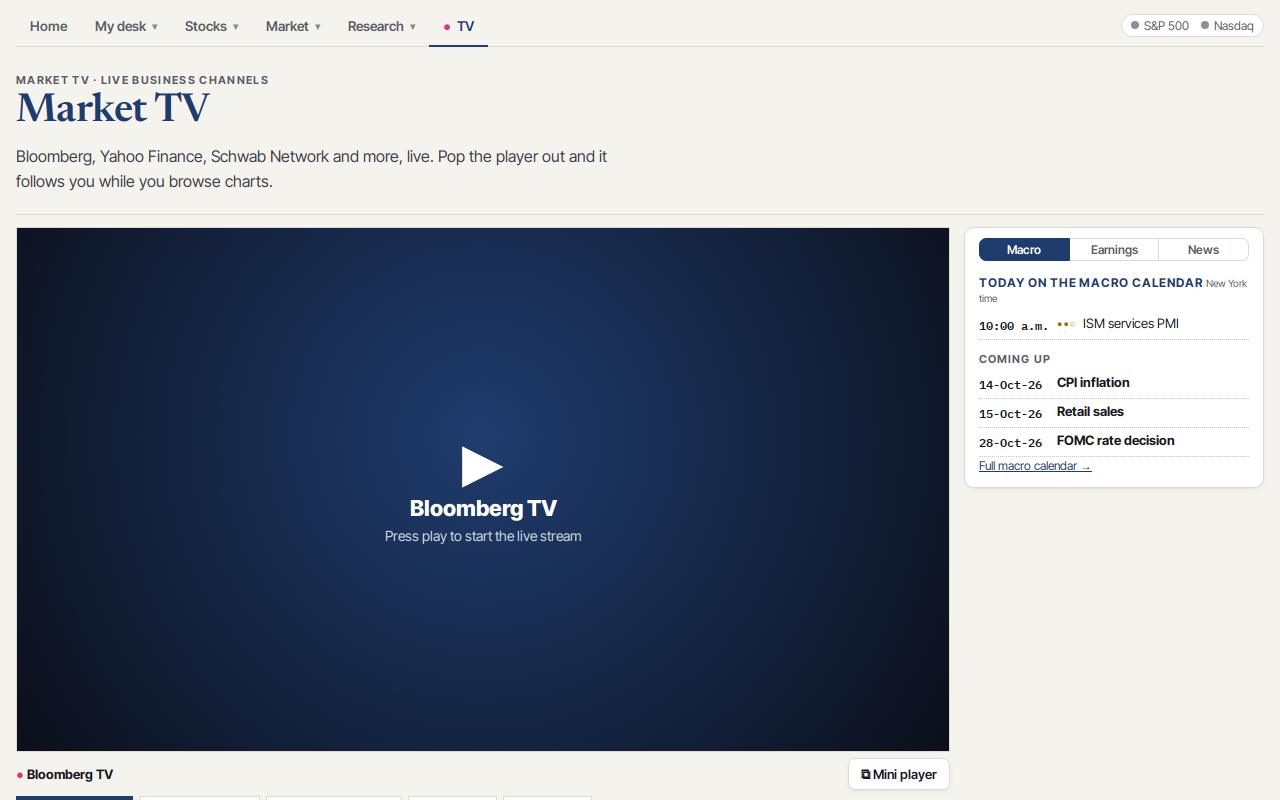
- Channels
- Business news and markets channels, live.
- Mini player
- If you leave the TV page while a channel is playing, it keeps playing in a small window in the corner.
17Command bar and keyboard shortcuts
Work like on a terminal: open any tool or any ticker without touching the mouse.
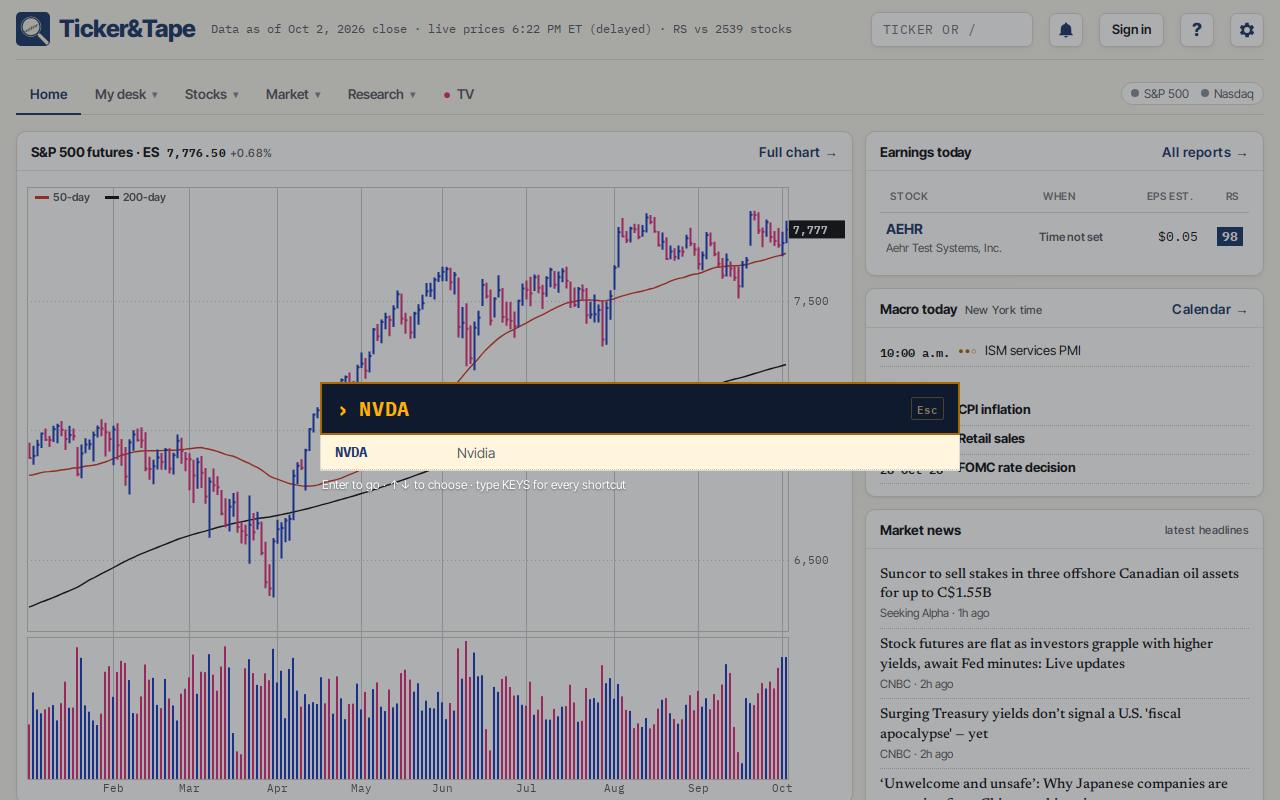
- Command bar
- Press / or Ctrl+K and type a ticker, a function or both: NVDA opens the chart, NVDA FA the financial statements, SCR the screener, ECO the macro calendar.
- G shortcuts
- Press G and then a letter: G H home, G W watchlist, G P portfolio, G S screener, G E ETFs, G F financials, G U superinvestors, G G groups, G M heatmap, G B breadth, G C compare, G I ideas, G R reports, G O macro, G K earnings, G T TV, G L school, G X breakout statistics.
- Your own keys
- In Settings → Keyboard shortcuts you can change any letter. Press ? to see the list at any time.
18Settings, dark mode and the app
The gear button opens Settings. Everything is saved to your account.
- Theme
- Light, Dark or Auto (follows your device). The dark theme redraws every chart with colors made for a dark screen.
- Language
- English, Español or Português.
- Chart
- Log or linear scale, bar type (H-L-C, OHLC or candles), bar weight, Ants, grid lines, indicators and the colors of the bars and volume.
- Install the app
- On your phone, open the site in the browser and choose Add to Home Screen (iPhone, from Share in Safari) or Install app (Android, Chrome). On a computer, use the install icon in the address bar. The help menu (?) has the steps.
Tip Questions or ideas? Write to contacto@tickerandtape.com or use Report a bug or suggest a feature at the bottom of every page.