Market & sectors Select Sector SPDR ETFs · click a sector to see its stocks
Commodities front-month futures · click a row for its chart
Top RS Rating price leaders
Top up/down volume accumulation, 50 days
Biggest movers today
Biggest buys superinvestors, last quarter
Top lists include stocks with at least $20M traded a day on average. Prices are delayed during the session. Data: Yahoo Finance.
Group
Color by
Size by
Colors
S&P 500 · 1-day change
Click a box to open its chart. Boxes are grouped by GICS sector.
Ranked
Research · industry groups, updated every trading day after the close
Industry groups
Most big winners come from the strongest groups. Every GICS sub-industry, built from every U.S. stock and ADR worth $150 million or more, ranked by the average relative strength of its stocks, with how the rank moved over 1, 3 and 6 weeks, equal-weight performance, the share of members above the 50-day line and the three strongest stocks in each group.
Sector rotation relative rotation graph vs the S&P 500How to read it
Each line is the path of the last weeks and the dot is today. The usual rotation is clockwise: Improving, Leading, Weakening, Lagging. RS-Ratio (to the right = beating the S&P 500) and RS-Momentum (up = gaining strength) are Ticker&Tape's own approximation of the classic method.
Rank = position by the average 12-month relative strength score of the group's stocks (last quarter weighted double). Arrows compare with the rank 1, 3 and 6 weeks ago. Performance is the simple average of the members. Click a group to see its stocks in the screener, or a ticker to open its chart. Not investment advice.
Chart wall
Daily bars with the 50- and 200-day lines, volume and the pivot (dashed). Click a chart to open it; the ‹ › arrows on the chart page step through this list.
Research · market health, updated every trading day after the close
Market breadth
Is the rally broad or carried by a handful of names? The market direction of the S&P 500 and the Nasdaq, read the O'Neil way with distribution days and follow-through days, next to how many stocks sit above their 20-, 50- and 200-day lines, new 52-week highs against new lows, the advance/decline line and the McClellan oscillator.
Breadth
How the market direction is worked out
Market direction is worked out automatically from price and volume and is not IBD's call. Distribution day: the index falls 0.2% or more on higher volume than the day before; it counts for 25 sessions or until the index rises 5% above that close. A rally attempt starts with the first up day after a low; a follow-through day comes on day 4 or later with a gain of at least 1.25% on higher volume. Under pressure: 5 or more distribution days, or the index under its 50-day line. Correction: 8% off the peak, or 6 distribution days under the 50-day line. McClellan oscillator: 19-day minus 39-day average of ratio-adjusted net advances. Not investment advice.
You're viewing a shared chart. Open a free account to use the screener, watchlists, market breadth, alerts and every tool on Ticker&Tape.
Research · several tickers on one timeline
Comparative charts
Stack tickers on the same dates to see who leads and who lags. Is the market carried by the mega caps or is the average stock joining in? Compare SPY with RSP and MAGS, or type a ratio like RSP:SPY to chart one against the other.
Presets click to load
Tickers
Moving averages (every chart)Moving averages show on the stacked view.
These moving averages apply to every chart. Use ⚙ on a ticker to give it its own averages or add volume.
Comparative charts
Scoreboard last close against the range start, each moving average and the range high · click a row for its chart
Daily bars from Yahoo Finance, with delayed prices during the session. A ratio (A:B) divides the closes of two tickers: rising means A is beating B. Performance % starts every ticker at zero on the first day of the range. Double-click a panel to open its full chart. Any ticker on the site can be compared; one that is missing loads after the next nightly update once it is in a watchlist.
Superinvestors · the portfolios of famous investors from their 13F filings
Superinvestors
What Buffett, Ackman, Druckenmiller, Li Lu, Tepper and other great investors own, and what they bought and sold last quarter. Updated as each fund files with the SEC, up to 45 days after the quarter ends.
Workspace
Drag a panel's edge or corner to resize it, drag ⠿ to move it, and use ⋯ for ready sizes. Tickers clicked in any list open in the 🔗 linked chart.
Market TV · live business channels
Market TV
Bloomberg, Yahoo Finance, Schwab Network and more, live. Pop the player out and it follows you while you browse charts.
●
Streams are played with YouTube's official player, from each channel's own live broadcast. Some channels are live only on weekdays or during market hours.
Fundamentals · up to 15 years of financial statements from SEC filings
Financial statements
Income statement, balance sheet and cash flow, annual and quarterly, and the valuation history: P/E, EV/EBITDA, price to sales and more against their own averages. Click any line to chart it, and add other companies to compare them line by line.
Chart click lines of the table to add or remove them (up to 4)
Portfolio · positions, P&L and journal
My portfolio
Log your trades and see your positions, your P&L by day, week, month and year, your stats as a trader and how you compare with the market. Private: only you can see it.
Performance vs the market time-weighted, cash flows excluded
Macro · the calendar, the Fed, rates and the economy
Macro calendar
The economic releases and Fed events that move the market, with what the futures market expects from the Fed at every meeting. All times are New York time (ET).
Treasury yield curve U.S. Treasury yields by maturity
Curve spreads 10-year minus 2-year and minus 3-month · below zero = inverted curve
Times in New York (ET)
Key indicators latest official data
The economy in charts data from FRED, St. Louis Fed
Release dates from the Bureau of Labor Statistics, the Bureau of Economic Analysis, the Census Bureau, the ISM and the Federal Reserve; values from FRED (Federal Reserve Bank of St. Louis). Fed odds are calculated by Ticker&Tape from the prices of 30-day fed funds futures and can differ slightly from other sources. Not investment advice.
Research · breakout statistics
How breakouts work out
Every breakout found by Ticker&Tape's base detection over the last two years, followed with one simple plan: buy at the pivot, sell at +20% or at −8%. Which bases, markets and volumes worked best.
Community · posts from traders
Community
Share what you are watching: setups, charts, the market. Tag stocks with $TICKER, like and reply to posts, and follow the traders you like.
Posts are members' opinions, not investment advice. Be respectful: spam, promotions and pump-and-dump posts are removed. Report anything that breaks the rules.
Research · The Daily Tape and The Weekly Tape
Research
Short reports with the charts and the ideas that matter. The Daily Tape comes out every trading morning before the open: overnight movers, earnings, breakouts and the stocks near a buy point. The Weekly Tape closes every week on Saturday: prices, breadth, leaders, earnings and the trade ideas scorecard.
Reports are generated automatically from Ticker&Tape data and are a research tool, not investment advice.
Research · updated every trading day after the close
Trade ideas
Leaders setting up right now: RS Rating of 80 or higher, trading above the 50- and 200-day lines, and sitting near a pivot, inside the buy zone or just out of a base. Found by the same automatic scan for every U.S. stock and ADR worth $150 million or more.
Track record every idea since it was flagged · closed at a 7% stop or after 8 weeks
Ideas come from an automatic scan, not from a person reviewing each chart, and are not investment advice or a recommendation to buy or sell. Buy point = pivot; buy zone = up to 5% above it; stop = 7% under the buy point. Returns in the track record are measured from the close on the day each idea was flagged, before costs.
Markets · world indexes, futures, currencies, yields and crypto
World markets
Every major stock market with its change today, this week, in three months and this year, whether it is open right now and its local time, plus index futures, the dollar, Treasury yields, gold, oil and crypto.
Loading…
Prices are delayed. Market hours are the regular session of each exchange in its own time zone; holidays are not shown.
Research · relative value
Compare companies
Up to five stocks side by side, line by line: performance, ratings, growth, valuation, margins, balance sheet and the chart base. The best of each line is in green and the worst in red.
Performance
Side by side
Loading…
Type one ticker in the command bar followed by RV (for example NVDA RV) to compare it with the biggest companies of its industry group. Not investment advice.
Research · seasonality
Seasonality
How a stock, index, commodity or crypto did in each month of the year: the average and median return, how often the month was up, and every year one by one.
SPY
Month by month % change
Loading…
Monthly returns run from the last close of one month to the last close of the next. Averages leave out the month in progress. Past seasonality does not guarantee future results. Not investment advice.
Markets · factor rotation
Factor rotation
Which kind of stock is leading the market: growth or value, small or large, high beta or low volatility, momentum, quality, credit and gold, each measured with the ratio between two ETFs. A rising ratio means the first one is winning.
Who leads
Loading…
The read
Trend = the ratio against its own 50-day average. Click a line to open the ratio chart. Not investment advice.
Markets · options and volatility
Options and volatility
The VIX curve from 9 days to 6 months, the SKEW index and the volatility of the VIX, and what the options market is pricing for the next expiry of the index ETFs and the most traded stocks.
VIX curve
VIX vs VIX 3-month above 1 = inverted curve
VIX, last 12 months
Implied volatility by expiry at the money · SPY, QQQ, IWM
Probabilities
Smile: implied volatility by strike
Open interest by strike
Expected move to the next expiry
Loading…
Expected move = the price of the at-the-money straddle of the nearest expiry. IV = its implied volatility. Probabilities assume the price follows a lognormal distribution with the implied volatility and no drift: a guide to what options are pricing, not a forecast. "Touches" is about twice the chance of ending beyond the level. Put/call above 1 means more puts than calls. Max pain = the strike where option buyers as a whole lose the most at expiry. Options data is from the previous close and updates every night. Not investment advice.
Markets · leadership
Leadership map
The strongest stocks on the site by RS Rating, grouped by industry, with where each one stands: breaking out, in a base, extended or correcting. Where the leaders cluster is where the money is going.
Where the leaders are
Loading…
Leaders = stocks with the highest RS Rating that trade $10 million or more a day at $10 or more. Status comes from the base and pivot found on each chart. Not investment advice.
Stocks · new issues
IPO calendar
The IPOs expected in the next weeks with their price range and size, every IPO of the last 12 months with its return from the IPO price, its first day, RS Rating and base, and the companies that just filed to go public.
Upcoming IPOs
Loading…
Dates and price ranges come from Nasdaq and can change until the IPO prices. Many of the biggest winners started as recent IPOs forming their first base. Not investment advice.
Markets · correlation
Correlation matrix
How stocks, ETFs, bonds, commodities and crypto move together, from daily returns: +1 = they move the same way every day, 0 = unrelated, −1 = opposite ways. Useful to diversify a portfolio or to see when everything starts moving as one.
Correlation matrix
Loading…
The read
Correlation of daily returns over the selected window, on the days every ticker traded. Not investment advice.
Markets · sentiment
Market sentiment
A fear and greed gauge from 0 to 100 built from six market readings: momentum, new highs against new lows, breadth, the VIX, safe-haven demand and junk bond demand. Each one is ranked against its own last year, and the gauge is their average.
Fear & greed
The last 12 months
Under 25 = extreme fear, 25–45 fear, 45–55 neutral, 55–75 greed, over 75 extreme greed. Extremes often come near turning points, but they can last.
Built every night from market data. Not investment advice.
Stocks · earnings season
Earnings season
How the earnings season is going: how many companies beat the EPS estimate and by how much, how the stocks reacted the next day, by sector, every report one by one and who reports next.
Every report
Loading…
By sector
Reporting next
EPS against the consensus estimate; next day = the move of the session after the report. Seasons: reports from January to March belong to the fourth quarter, April to June to the first, and so on. Not investment advice.
Calendar · ex-dividend dates and stock splits
Dividends and splits
The ex-dividend dates of the stocks and ETFs on the site, from last week to three weeks ahead, with the amount, the yield and the payment date, and the stock splits coming up. Buy before the ex-dividend date to receive the dividend.
Ex-dividend dates
Loading…
Dates come from Nasdaq and can change; companies confirm them when they declare the dividend. Yield = the last year's dividends over the last price. Not investment advice.
Research · earnings calendar
Who reports this week
Every U.S. stock and ADR worth $150 million or more that reports, split into before the open and after the close, biggest companies first. Upcoming reports show the consensus EPS and the growth it implies against the same quarter last year; past reports show the surprise and how the stock reacted the next session.
Dates and times come from Nasdaq and Yahoo Finance and can move: companies confirm them a few weeks ahead. Reaction = change in the first session that traded on the report (the same day for reports before the open, the next day for reports after the close). Not investment advice.
Est. MMXXVIBuilt by traders, for traders
The trading terminal for stock traders.
Everything a professional desk looks at, in one screen and for free: charts with RS ratings, bases and pivots for about 5,000 U.S. stocks, market breadth and sentiment, options and futures positioning, fundamentals, what the superinvestors buy, and a community of traders.
Free during betaNo credit cardEnglish · Español · Português
T&TDashboardU.S. stocks & ADRs
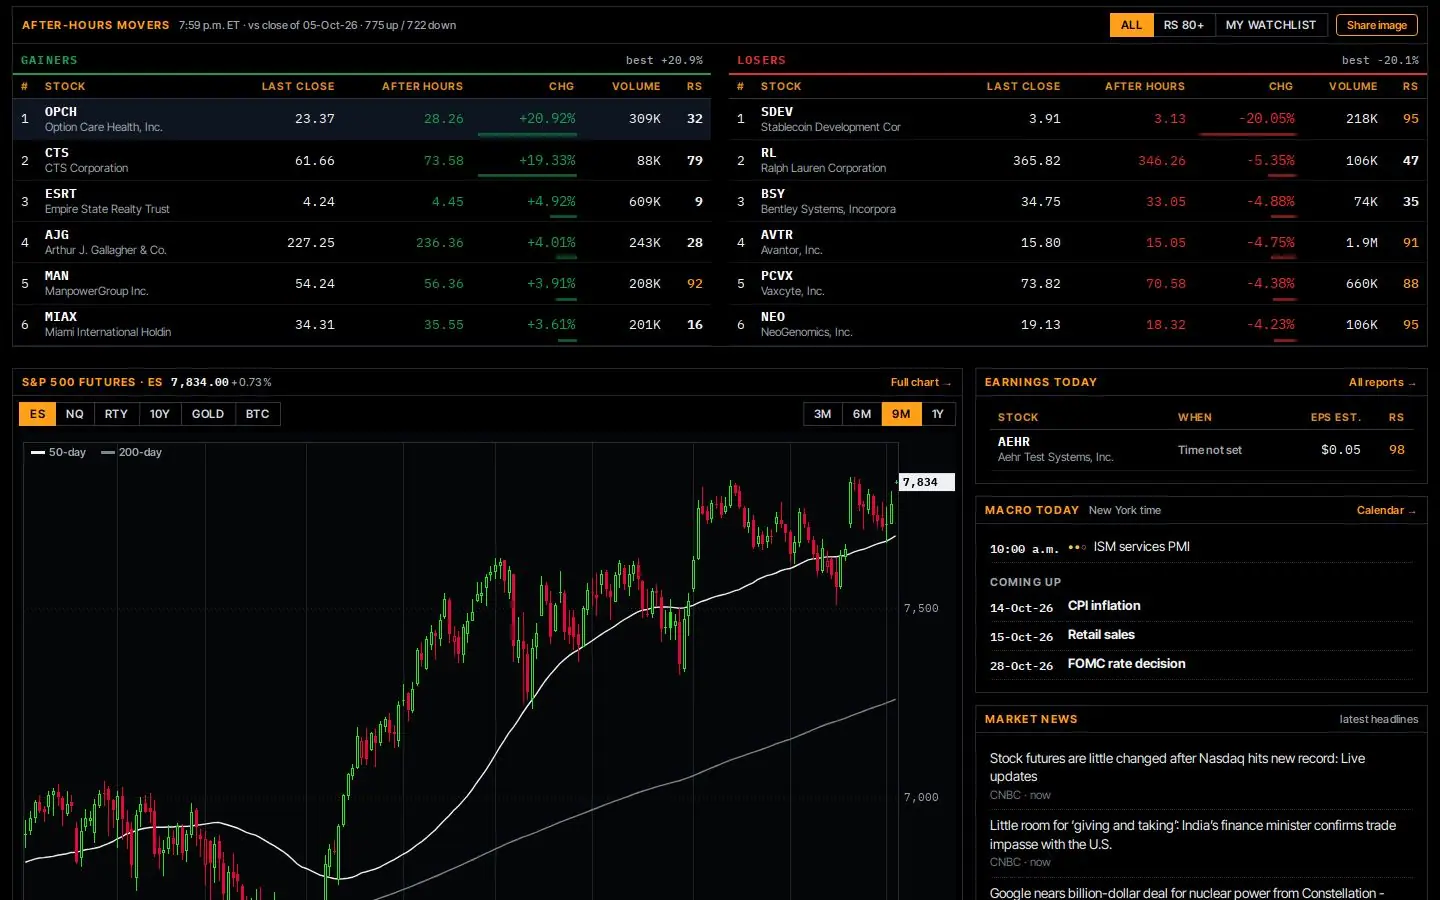
The market at a glance: index futures, sectors, commodities, the day's earnings and macro calendar, and a live tape.The boardUpdated every trading day after the close
S&P 500market direction
Nasdaqmarket direction
Coverage5,000stocks rated every session
Industry groups140+ranked by relative strength
Trade ideasleaders near a buy point today
One keyboardEvery tool
Press / and type a function. Like a terminal.
Every tool has its own code: WEI for world markets, BRDTH for breadth, OPT for options, FA for financials, or a ticker followed by its function, like NVDA RV.
The terminal
Your whole market on one screen.
A dashboard that opens with the index futures, the sectors, commodities, earnings and the macro calendar of the day, a live tape and a status bar. Build your own Workspace with up to four linked panels: charts, your watchlist, movers, the heatmap, news and alerts.
Live prices every 15 minutes during the session
Function keys and keyboard shortcuts for everything
Your own colors, candles and layout, synced on every device
HOMEWSWEIHEAT
HOME · Market dashboardWS · Workspace
Charts
Charts that tell you where you are.
Daily and weekly charts with the RS line, labeled volume, the earnings strip and the current base with its pivot and buy zone, found automatically. Add your own averages and studies, draw, set alerts and share the chart on X with one click. Scan a whole list at once on the chart wall.
Hollow or solid candles, O'Neil bars or OHLC
Bases, pivots, swing levels and Ants marked for you
Keys for everything: ranges, scale, drawings, alerts
GPCMPSEAS
GP · ChartChart wall
Market intelligence
Know the market before you pick the stock.
Market direction the O'Neil way with distribution and follow-through days, breadth, a fear and greed gauge built from six readings, the leaders grouped by industry, factor rotation between growth and value, small and large, risk-on and risk-off, and every market in the world with its session.
Distribution days, follow-through days and the market status
Fear & greed from 0 to 100, with its history
Who leads: industries, factors and countries
BRDTHSENTLEADFCTGRP
BRDTH · Market breadthSENT · Fear & greed
Options & futures
See what the options and the big money are pricing.
The VIX curve against a week and a month ago, implied volatility by expiry, the expected move of every big stock, the chance of reaching any price, the smile and open interest by strike. And on the chart of every future, how large speculators, hedgers and small traders are positioned, from the CFTC.
Probabilities for any target and any horizon
Futures positioning (COT) with its 3-year index
World indexes, currencies, yields, commodities and crypto
OPTWEIECO
OPT · Options and volatilityCOT · Futures positioning
Research
Know the business, not just the chart.
Fifteen years of income statement, balance sheet and cash flow, up to five companies side by side line by line, seasonality month by month, the earnings season scorecard, the IPO calendar, and what the superinvestors and insiders are buying.
SEC filings for every U.S. stock
Compare companies with the best of each line in green
The Daily Tape and The Weekly Tape research reports
FARVERSIPORES
FA · Financial statementsRV · Compare companies
Find the next leader
A screener with your own formulas.
Every stock with its RS Rating, Composite, EPS and sales growth, base and pivot. Pick your columns, save your screens, or write your own formula like rs >= 90 and eps > 25. Every day the scan finds the leaders near a buy point, with a track record you can check.
About 5,000 stocks, small caps included
Trade ideas with pivot, buy zone and stop
Breakout statistics: how every kind of base worked
SCRIDEASLEADWL
SCR · ScreenerLEAD · Leadership map
Smart money
Follow the superinvestors and the insiders.
The 13F portfolios of the best-known investors: what they bought and sold last quarter and the stocks they agree on. And every insider purchase in the open market, cluster buys and 10% owners, straight from the SEC filings.
Found by the daily scan: RS Rating 80 or higher, above the 50- and 200-day lines, near a pivot or just out of a base.
The research desk
Everything the big desks look at. Without the desk fee.
Fundamentals and research reports
Income statement, balance sheet and cash flow going back ten years, margins and returns, valuation, analyst estimates and peers, plus a downloadable research report for any stock.
Superinvestors and insiders
The quarterly portfolios of the best-known funds, their biggest buys and sells and the most owned stocks. Insider buying, cluster buys and 10% owners, straight from the filings.
A trading school, free
From your first chart to your first plan: candlesticks, volume, trends, moving averages, bases and buy points, fundamentals and position sizing, lesson by lesson.
Charts and the chart wall
Daily and weekly charts with the RS line, labeled volume, the earnings strip and the current base with its pivot, your own indicators and drawings, and a wall to scan a whole list at once.
Ratings, screener and heatmap
RS Rating, Composite and SMR on every stock, a rank for every industry group, a screener with your own saved screens, and the whole market at a glance on the heatmap.
Breakout statistics
Thousands of past breakouts, measured: how often each kind of base worked, and how much the market, the volume and the RS line changed the odds.
Macro, earnings and Market TV
The economic calendar in New York time, the earnings calendar with every stock's setup, market news from many sources, and live financial TV next to it all.
Community and trade ideas
A feed where traders share what they are watching, tag stocks with $TICKER, like, reply and follow each other, plus a daily list of leaders near a buy point.
Options, futures and sentiment
The VIX curve, implied volatility, expected moves and probabilities, futures positioning from the CFTC on every future, and a fear and greed gauge built from six market readings.
Leaders, factors and correlation
The RS leaders grouped by industry, factor rotation between growth and value or risk-on and risk-off, and a correlation matrix for any tickers.
Portfolio, alerts and watchlists
Track your positions and your results, see your portfolio's beta, value at risk, correlations and open risk to your stops, get price, trendline and moving-average alerts, and keep your lists, drawings and notes in sync on every device.
Every sessionRatings and charts rebuilt after every close, prices updated throughout the day.
Every deviceDesk, laptop or phone, or installed as an app. One account keeps your lists, settings and drawings in sync.
Alerts that reach youSet a level on any chart and get a phone notification, an email and a notice on the site when it trades.
English · Español · PortuguêsThe whole interface in three languages, from Settings.
From the founder
Built by traders. For traders.
Every serious trader knows the routine: one site for charts, another for ratings, a spreadsheet for the watchlist, a calendar for earnings, and a dozen tabs open before the opening bell.
Ticker&Tape started as the tool I wanted for my own trading: one room where the charts, the fundamentals, what the best investors are buying, the direction of the market and the next setup all sit on the same desk.
It's built on a simple idea. The edge isn't having more information. It's seeing the right information clearly, every single session. That's what we work on every day, and we're just getting started.
Gonzalo Sanchez LachowiczFounder, Ticker&Tape
Up and running in a minute
Open a free account. An email and a password. Nothing else.
Star the stocks you follow. Any U.S. stock or ADR, big or small.
Check the board after the close. Leaders, setups and pivots, updated every trading day.
Trading school
New to trading? Start here.
A free course from zero: what the stock market is, how stocks work, how to trade, how to read a chart, bases and buy points, fundamentals, risk and how to manage a portfolio. Short lessons, live examples from today's market, a quiz in every lesson and a certificate at the end.
A complete research platform for stock traders and investors: fundamentals and research reports, superinvestor portfolios and insider trades, charts and ratings, screeners, a heatmap, market breadth, macro and earnings calendars, Market TV and a free trading school, all in one place.
Is it free?
Yes. Ticker&Tape is free during the beta. All you need is an email and a password. No credit card.
Which stocks are covered?
About 5,000 U.S. stocks and ADRs: every member of the S&P 1500 and the Nasdaq-100, plus every other U.S. stock and ADR worth $150 million or more. ETFs cover indexes, sectors, industries, commodities, bonds and countries.
How often is the data updated?
Ratings, bases and charts are rebuilt after every close, and prices update throughout the trading session.
How is the RS Rating calculated?
It measures a stock's 12-month price performance, with the most recent quarter weighted double, and ranks it from 1 to 99 against every stock we cover. The full formula, and the ones for every other rating, are in the Methodology. New to the terms? See the Glossary.
Can I set alerts?
Yes. Price levels, trendlines and moving averages on any chart, delivered by email and on the site.
Does it work on my phone?
Yes. Your watchlists, drawings and settings sync across desktop, laptop and phone.
Is this investment advice?
No. Ticker&Tape is a charting and research tool. Ratings and setups are calculated automatically and are a starting point for your own analysis.
Colors follow your chart's up/down colors.+32% strong: EPS or sales +25% or more, U/D 1.5+, inside the buy zone, heavy volume on an up day−9% weak: big drop, heavy volume on a down day, far below highs+28% extended: 25%+ over the 50-day or 5%+ past the pivot
RS Rating: each stock's 12-month performance (last quarter weighted double) ranked against every stock on the site, 1–99. All stocks: every S&P 1500 and Nasdaq-100 member plus every other U.S. stock and ADR worth $150 million or more; their earnings and sales data refresh in rotation. Star any ticker to add it to your watchlist; tickers outside these indexes load after the next nightly update. Bases and pivots are detected automatically from daily bars and are a starting point for your own read of the chart. Data: Yahoo Finance, end of day. How the ratings work ·
Large speculators = funds and big traders (non-commercial); commercials = producers and users who hedge; small traders = positions below the reporting level. COT index = where the speculators' net position sits within its 3-year range (0 = the most short, 100 = the most long). Weekly CFTC report: positions on Tuesday, published Friday.
From the chart
Business description
Peers same industry group
From the chart
Annual earnings & sales last 10 years
Quarterly earnings & sales reported vs. expected · y/y growth
Earnings reaction how the stock moved after each report
Base analysis auto-detected
Analysts consensus
News latest headlines
Insider activity Form 4 filings
Institutional ownership 13F filings
Superinvestors latest 13F of the investors we track
 Ticker&Tape